
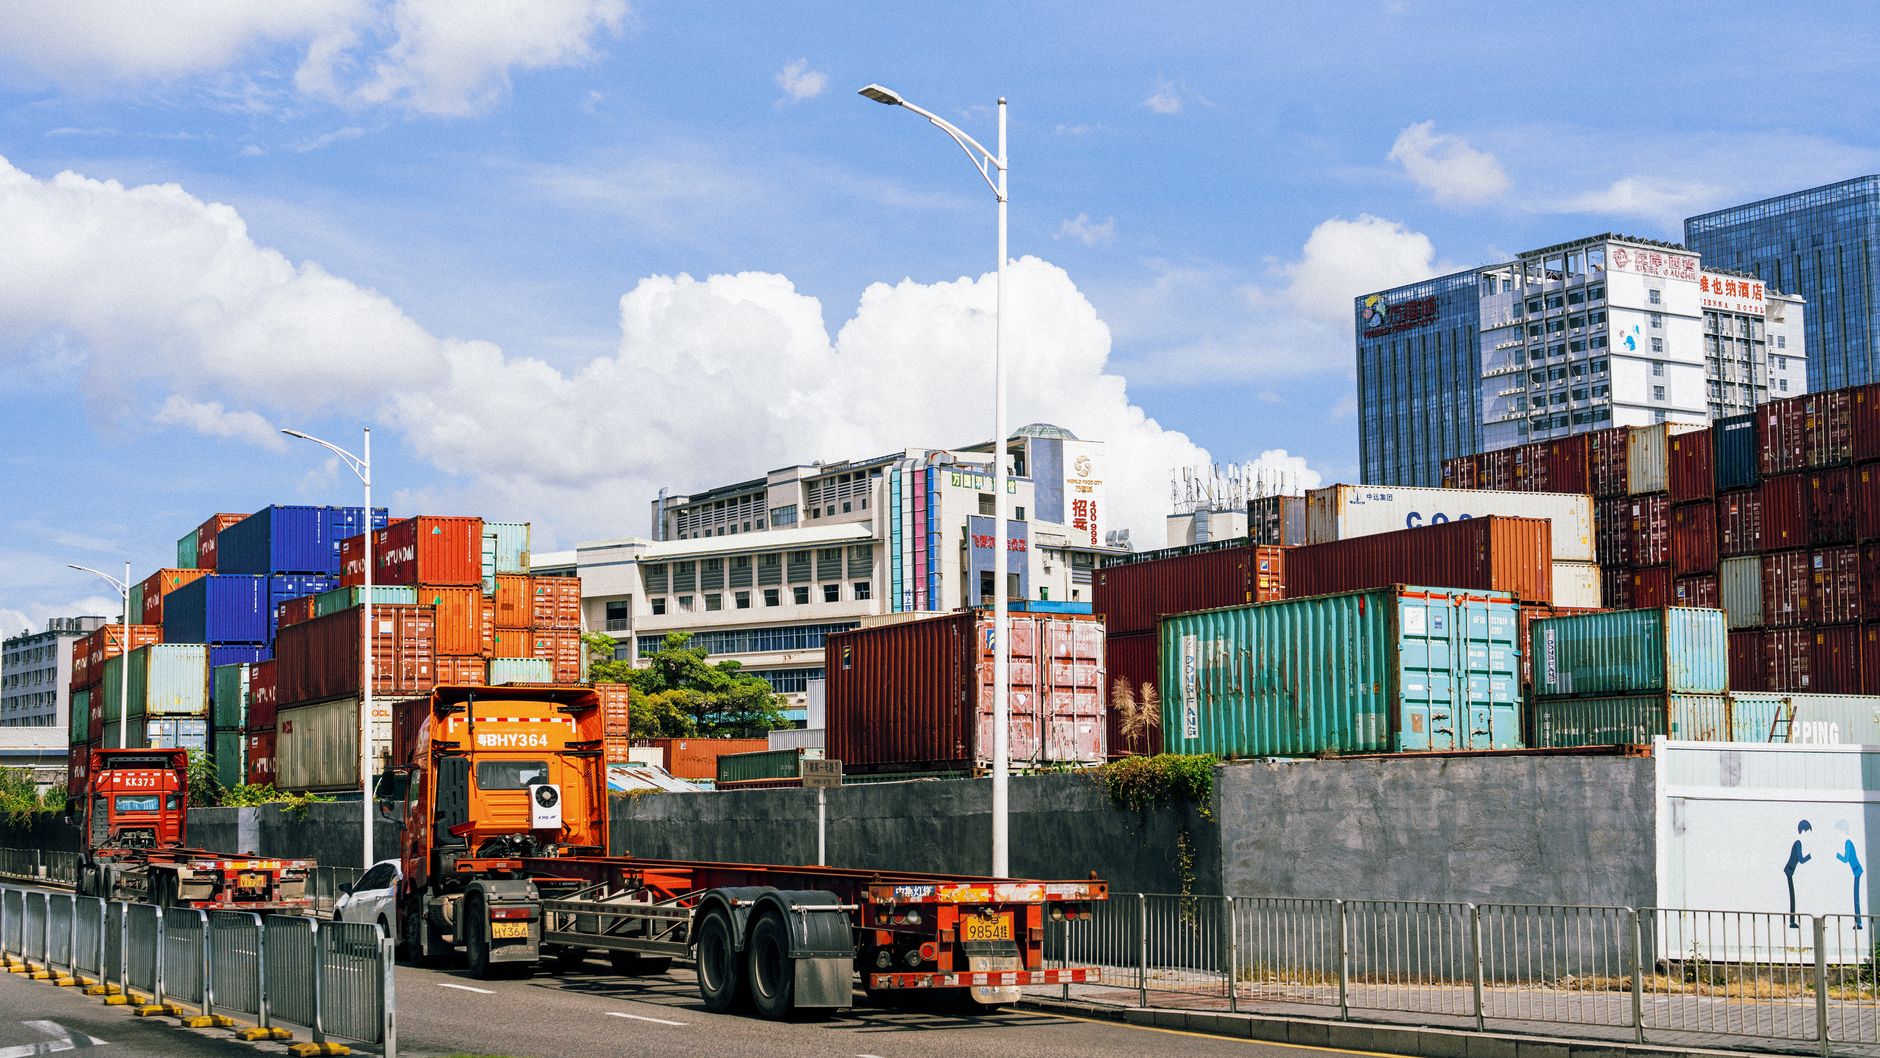
Vehicle Fleet Management: Cut Fuel, Idle Time and Breakdowns

Every plant, port and logistics yard runs on vehicles: company trucks, contractor tippers, forklifts, staff buses and pool cars. When nobody can say where they are, how much fuel they burn or why a trip took four hours instead of two, costs leak quietly. Vehicle fleet management is the discipline of tracking, scheduling and maintaining those vehicles so they move more loads with less fuel, fewer breakdowns and fewer surprises.
This guide is for plant, port, logistics and security managers in India and the Gulf who want a practical view: what a fleet system actually does, which numbers to watch and how to roll it out without disrupting daily operations.
What vehicle fleet management covers in a working plant
A fleet system is more than a GPS dot on a map. In an industrial setting it joins four jobs that are usually done on paper or in separate spreadsheets:
- Location and trip tracking: live position, route history, geofences around gates, loading bays and yards.
- Driver and vehicle records: who drove which vehicle, licence and permit validity, fitness and insurance dates.
- Fuel control: how much was filled, how much was used and where the difference went.
- Maintenance planning: service by kilometres or engine hours, tyre changes, breakdown history.
When these sit in one system, a manager can answer simple questions in seconds: which vehicles were idle yesterday, which driver keeps over-speeding inside the plant, and which truck is due for service before the weekend rush.

Where fleet costs leak without anyone noticing
Most fleet losses are small and repeated, which is why they go unnoticed. Typical leaks we see on Indian and Gulf sites include:
- Idle engines: trucks left running while waiting at the gate or loading bay burn fuel for nothing.
- Unplanned detours: personal trips or longer routes that never show up on a trip sheet.
- Fuel pilferage: filled litres that do not match the distance driven.
- Missed services: a skipped oil change becomes an engine overhaul a few months later.
- Empty running: vehicles returning empty because dispatch did not know a load was waiting nearby.
None of these needs complex analytics to find. They need consistent data from every vehicle, every day.
Core features of a vehicle fleet management system
| Feature | What it solves |
|---|---|
| Live GPS tracking and geofences | Know when a vehicle enters or leaves a gate, yard or customer site |
| Trip and route history | Proof of delivery times, detours and stoppages |
| Driver behaviour alerts | Over-speeding, harsh braking and long idling inside the plant |
| Fuel monitoring | Fill-ups and consumption compared with distance and engine hours |
| Maintenance scheduler | Services planned by kilometres or hours, not memory |
| Document reminders | Permits, insurance, fitness and PUC renewals before they expire |
| Reports and ERP export | Cost per trip and per kilometre for finance teams |
Suraj Informatics brings these together in its vehicle fleet management system, built for industrial sites where vehicles move between gates, weighbridges and loading bays rather than only on highways.
Fuel control: the fastest payback in fleet management
For most fleets, fuel is the largest running cost after salaries. That makes it the first place to look for savings. A fleet system flags trucks whose consumption per kilometre drifts away from the fleet average, highlights long idling and shows fill-ups that do not match the route driven.
Sites with their own diesel tanks or dispensers get even more control when fleet data is linked to automated fuel dispensing and monitoring, so every litre issued is tied to a vehicle, a driver and a time stamp. Discrepancies stop being an argument and become a report.
Linking the fleet with gates, weighbridges and yards
Inside a plant or port, the vehicle’s day is a chain of events: gate entry, weighment, loading, second weighment, exit. When fleet tracking is connected to these points, managers see the whole turnaround, not just the road trip. A truck that spends forty minutes waiting at the weighbridge shows up as a process problem, not a driver problem.
Suraj Informatics runs these flows on the GATIVRA platform, which combines gate, weighbridge, parking and yard events with vehicle data in one dashboard. The result is one timeline per vehicle from arrival to exit.
Key fleet KPIs to track every week
- Vehicle utilisation: hours or trips worked compared with hours available.
- Fuel cost per kilometre: per vehicle and per route, to spot outliers early.
- Idle time: minutes with the engine running and the vehicle stationary.
- On-time trips: share of trips that met the planned arrival window.
- Maintenance cost per vehicle: and the number of unplanned breakdowns.
- Turnaround time on site: from gate entry to gate exit.
Pick four or five of these, set a baseline in the first month and review them weekly with transport and security teams. Trends matter more than single numbers.
Rolling out fleet tracking without disrupting operations
Start with a pilot group
Fit devices on ten to twenty vehicles that cover your main routes and vehicle types. Use the first weeks to tune geofences, alert limits and reports before scaling up.
Bring drivers on board early
Explain what is tracked and why. When drivers see that data also protects them in disputes about delays or fuel, adoption is much smoother.
Connect the data to decisions
Agree who reads which report and what action follows. An alert that nobody acts on is just noise. Link the system to your ERP so trip and fuel costs reach accounts without re-entry.
Vehicle Fleet Management FAQs
What is vehicle fleet management?
It is the tracking, scheduling, fuel control and maintenance of a group of vehicles using one system, so the fleet runs at lower cost with fewer breakdowns and delays.
Is fleet tracking only useful for long-distance trucks?
No. Plants, ports and warehouses gain a lot from tracking vehicles on site, where idling, queues and unplanned movements cause most of the losses.
How quickly does a fleet system pay back?
It depends on fleet size and fuel spend, but fuel savings and fewer breakdowns usually show within the first few months. Measure your baseline before you start.
Can fleet data be shared with our ERP?
Yes. Trip, fuel and maintenance records can be exported or integrated, so finance teams see cost per trip and per kilometre without manual work.